


I’ve shown you the snow back numbers across the state many times. I do it every year – good or bad – it’s important to get an idea of what runoff and water storage will look like and gives a really good overview of how the snow is for skiers and borders. Here’s the latest looks at those.
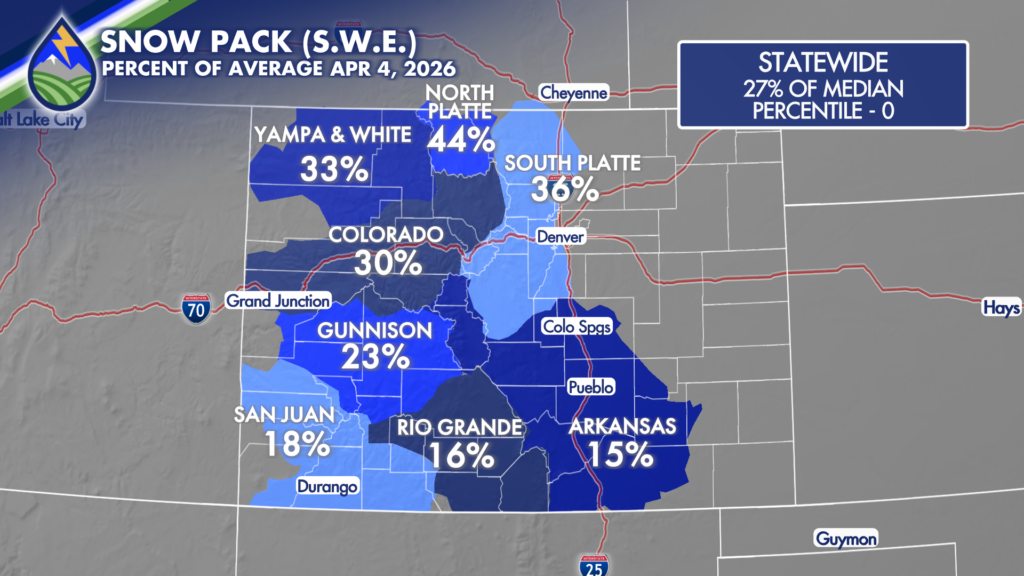
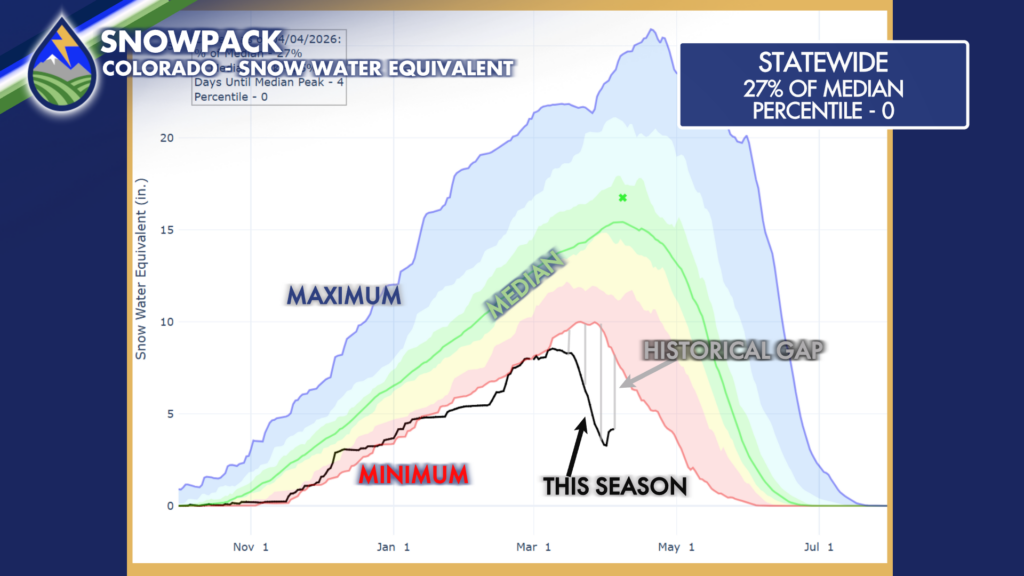
Not a surprise that they aren’t great. Even with some snow this week there is still a really big gap of about 4″ of liquid equivalent, which is between three and four feet of snow between where we are today and the previous MINIMUM! Compared to just average, we’re about 15.4″ of liquid behind…that’s more than 20 feet of snow. It’s hard to even wrap your head around that, right?
Here’s a different way to look at it. About a decade ago, the Accumulated Severe Winter Weather Index was developed to “to objectively quantify and describe the relative severity of the winter season, “according to Barbara Mayes Boustead, one of the developers. She’s a meteorologist at the National Weather Service who developed the index related to the intensity and persistence of cold weather, the amount of snow, and the amount and persistence of snow on the ground.
Here’s a good summary of how it works from the Midwest Regional Climate Center at Purdue University in Indiana. “Daily scores are calculated based on scores assigned to temperature, snowfall, and snow depth thresholds (pictured right). Daily scores are accumulated through the winter season, allowing a running total of winter severity in the midst of a season, as well as a final, cumulative value characterizing the full season.”
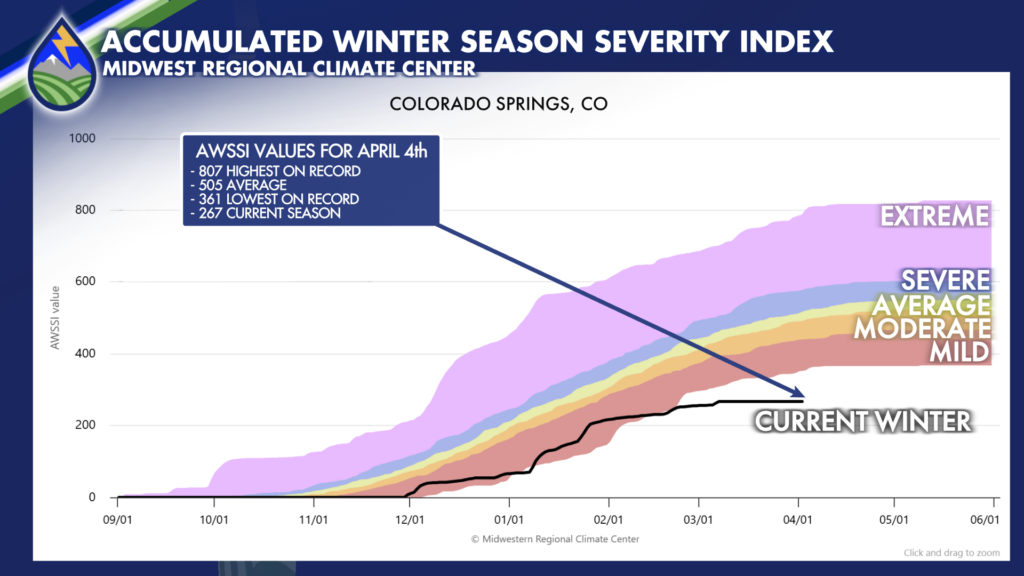
So, here’s our graph. You can see it’s historically low – this data set goes back through 1950 in Colorado Springs. For April 4th when I’m writing this the we are are 267 for our index score for the season. The previous low was 361. Average for the date on the Index is 505. No matter how you look at it. It’s not good.