







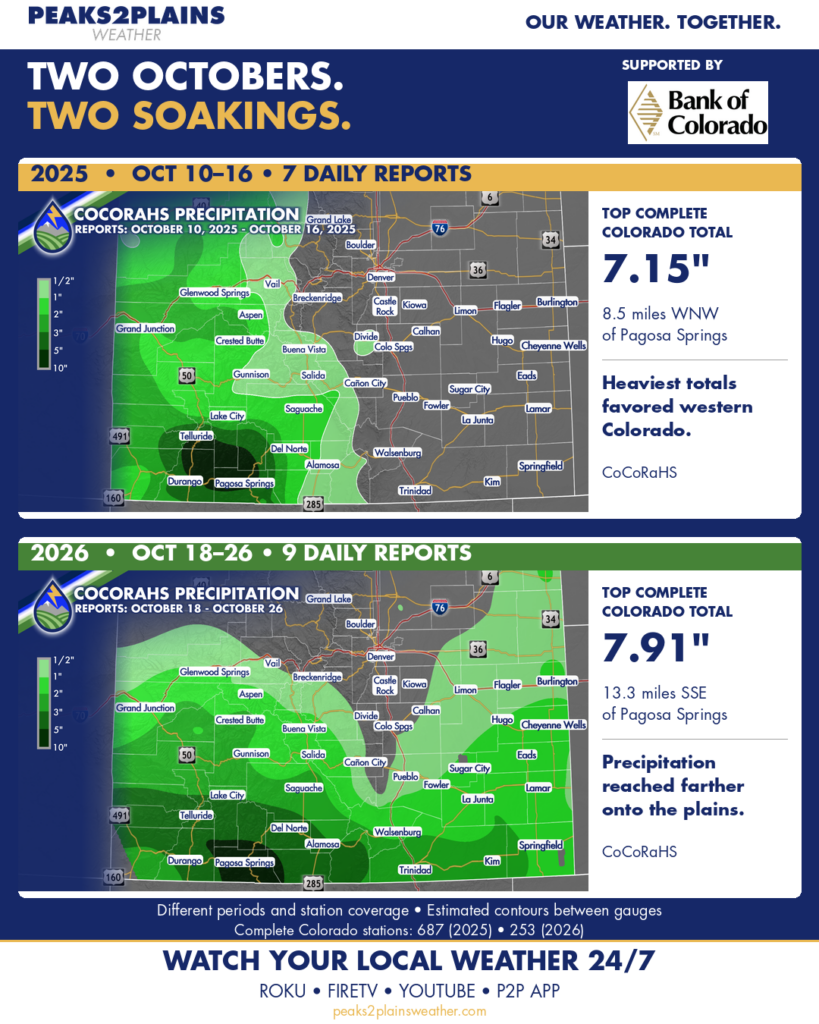
COMPARING THE OCTOBER HEAVY RAIN EVENTS OF THE LAST TWO YEARS
Both events hammered the San Juans.
In 2025, the rain was mainly in western Colorado. This year’s map shows a much broader reach onto the eastern plains.
Even around Pagosa Springs, the differences are striking. The same gauge 8.5 miles WNW of town measured 7.15 inches in the 2025 period and 5.56 inches in 2026. Another gauge 13.3 miles SSE went from 4.77 inches to 7.91 inches. Precipitation varies over small scales, particularly in the mountains.
One detail to note: the data does vary. CoCoRaHS reports are from volunteers, so sometimes days are missed. These are also two different reporting windows. Seven days in 2025 compared with nine this year. The station coverage varies each year, too.
Given the data variances, the frequency and coverage of the reports are still useful on this broader scale to make comparisons and contrasts.
FLOODING DIFFERENCE
Given similar amounts in the southern San Juans, why has the flooding been more impactful this year? Particularly, the spatial coverage of the flooding is more significant because heavier rain fell east of the continental divide compared to 2025…that’s why the Conejos and Rio Grande Rivers have flooded in the San Luis Valley.
Around Pagosa and areas westward, this year featured some heavy rain last week, too. We didn’t get that in 2025 and that may have contributed to the higher crests on the San Juan River and other river flooding over southern Colorado. The San Juan River in Pagosa crested 2.2 feet higher this year at 15.02 feet compared to 12.82 feet in 2025.
Thanks to the CoCoRaHS volunteers measuring this stuff, one gauge at a time. What was the difference between the two years where you are? Let me know!